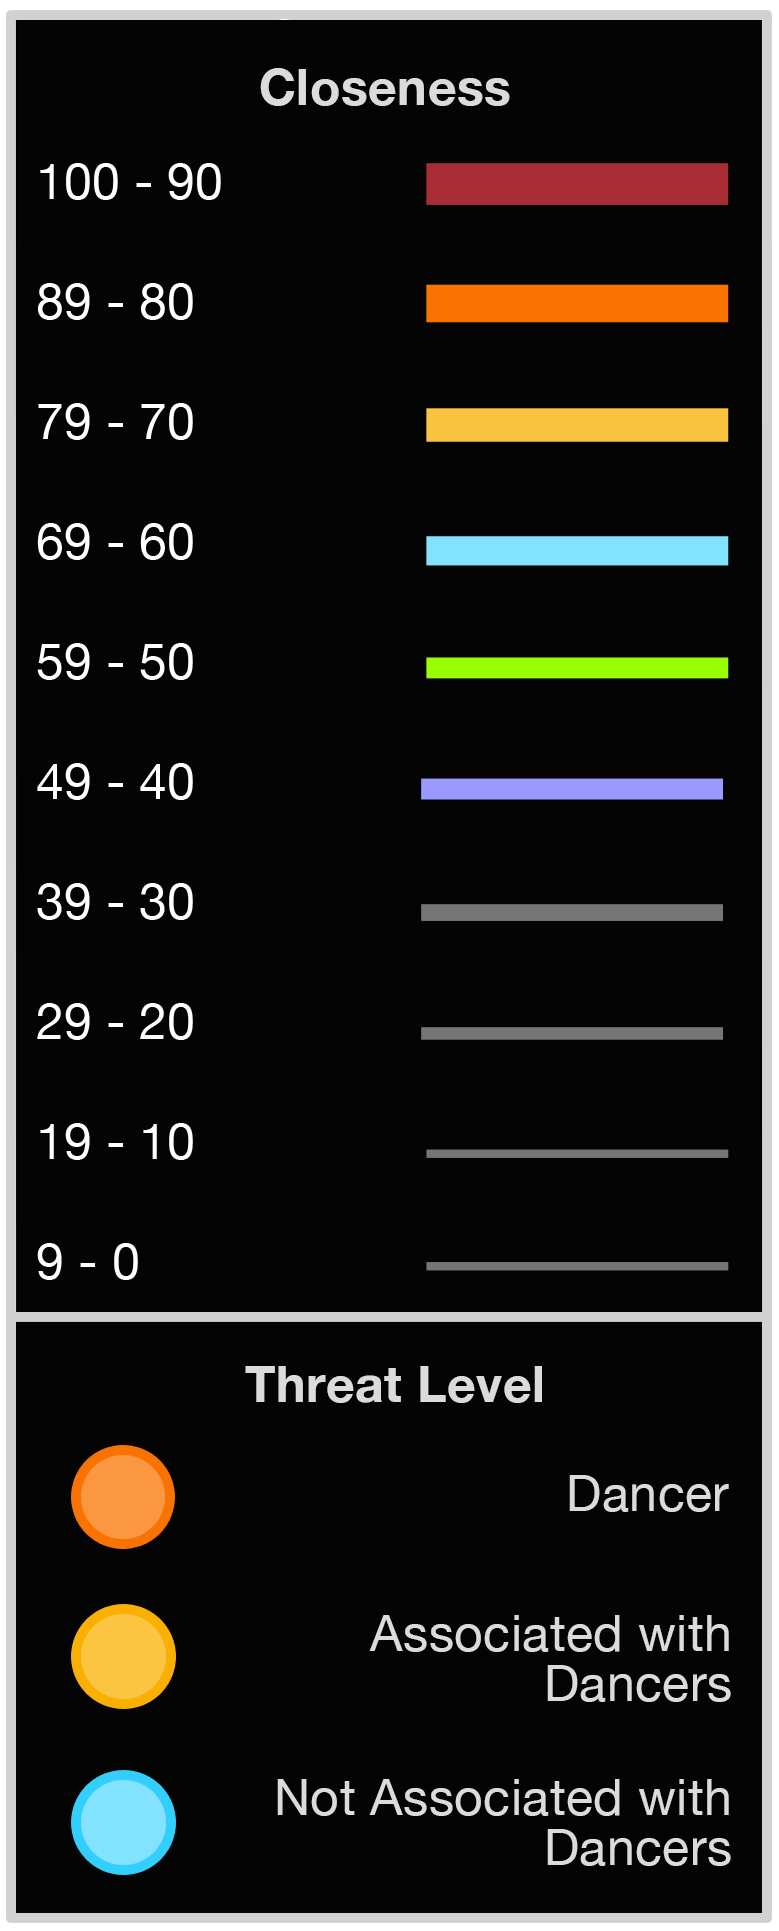
Law enforcement and intelligence agencies use Social Network Analysis (SNA) diagrams to understand, predict, and intervene in human behavior.
This diagram is made by using algorithms to
calculate the number of scenes where characters from the 1984 film
Breakin’ 2: Electric Boogaloo were identified by a
facial recognition algorithm as being together in a particular scene:
- the strength of a relationship (referred to as “closeness”) is represented by the thickness of the line that connects two nodes.
Check out the
Human-Generated SNA Diagram to see how manually creating an SNA diagram leads to different conclusions.
Controls:
- Zoom using mouse wheel
- Hover over nodes to see character details
- Drag nodes to reposition them
- Click refresh button to reset diagram
- Click Legend button to show / hide Legend
